This article provides information on top
In this article, we compare the past performance of top Latin-American stock funds, with that of the South America Focus portfolio offered by Covestor Investment Management. You may read more on our introduction to this Brazilian and Latin-American stock portfolio, and there are more Latin America funds on our Brazil ETF's page.
Top Latin-America funds
| Fidelity Latin America | T. Rowe Price Latin America | BlackRock Latin America | iShares S&P Latin America 40 Index | SPDR S&P Emerging Latin America | |
|---|---|---|---|---|---|
| Ticker | FLATX | PRLAX | MDLTX | ILF | GML |
| Assets under management ($M) | 4,236 (1) | 2,995 (1) | 776 (1) | 2,253 (1) | 155 (4) |
| Type | No-load mutual | Mutual | ETF | ||
| Inception date (1) |
4/19/1993 | 12/29/1993 | 9/27/1991 | 10/25/2001 | 3/19/2007 |
| Exchange | n/a | NYSE Arca | |||
| Trailing 5yr annualized return (4) | 20.24% | 24.84% | 24.08% (6) | 23.85% | (5) |
| Alpha (2)(3) | 20.22 | 26.35 | 26.66 | 24.94 | |
| Beta (2)(3) | 1.34 | 1.45 | 1.47 | 1.28 | |
| R2 (2)(3) | 78 | 83 | 83 | 80 | |
| Sharpe ratio (3) | 0.26 | 0.39 | 0.38 | 0.43 | |
(1) As informed on the fund's Web page on May 17, 2010.
(2) Relative to MSCI EAFE NR USD, according to Morningstar.
(3) Trailing 3 years ending in April 2010.
(4) According to Morningstar, as published on May 17, 2010.
(5) Its history is not long enough for this performance analysis.
(6) Not adjusted for loads.
The table above shows data for the four largest Latin-American funds, plus a relatively-new ETF that belongs to the popular SPDR family. We can see that, during the last three years, iShares S&P Latin America 40 Index (ILF) experienced the least volatility in the group, as evidenced by its lower beta (<-- CORRECT THIS). Nevertheless, other funds returned more, albeit being more volatile, up to the point of doing better even on a risk-adjusted basis, as indicated by their higher alpha.
Bear in mind that the annualized return row corresponds to the trailing five years, but alpha and beta were calculated for the last three only. Fidelity Latin America (FLATX) is the largest fund of the six, with more than four billion in assets. Its results are behind the rest, but the three-year and five-year performance are excellent for all of these funds, reflecting the profitability of the Latin-American markets in recent times.
Total returns
We will now use these funds as benchmarks to analyse the past performance of the South America Focus portfolio at Covestor. The graph below shows the total return of this portfolio compared with the top Latin-American funds shown before, since its inception on December 3, 2009, as of writing on May 17, 2010. The data for South America Focus was obtained from its profile page at Covestor, where further details can be found.
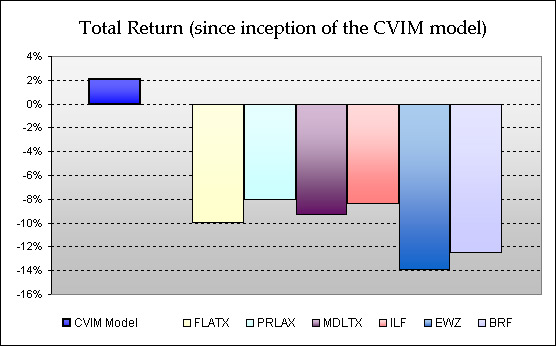
As can be seen, in this nearly-six-month period was very poor for the aggregated Latin-American markets, South America Focus kept a larger part of its original value.
We must keep in mind that the period under analysis is rather short to draw conclusions. However, it is interesting to note that this result is consistent with the advantages that, as we argumented, this model portfolio has to offer. Particularly its different —and presumably better— diversification, achieved thanks to the possibility to trade more flexibly.
Quarterly results
To evaluate a portfolio that outperformed its benchmarks, it is of interest to know if the good result occured in one or few bursts, or if it was more or less sustained throughout time, because the first case might be an indication of luck being the reason for it. It is not a conclusive test at all, but it provides some clues that enrich our analysis. Moreover, it is also useful to inspect what happened with the portfolio under different market behaviour, so as to check if the historical performance was consistent with the qualitative arguments presented on our introduction to the model. Especially since the market performance was negative, because such a result may be the consequence of excessive risk avoidance, which may curtail profits during better, future times.
For that purpose, let's analyze the previous results, but split in three time periods:
- The inception of the portfolio until the end of the fourth quarter of 2009.
- The first quarter of 2010.
- What has passed of the second quarter of 2010 until the day of this writing (May 18).
The first of these graphs shows an outperformance in a period that was rather weak for the Latin-American markets:
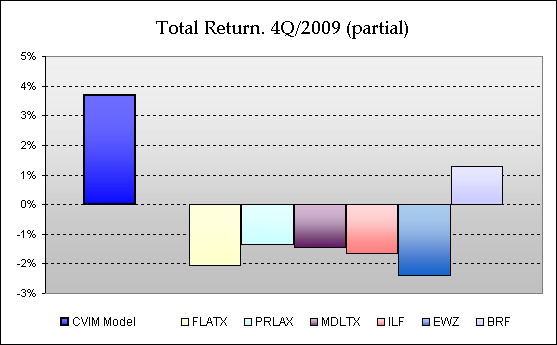
During this period, Chilean stocks and a few other picks were successful. The fact that the investment had a good profit with disregard of market behaviour, is a sign against the “excessive risk avoidance” hypothesis.
It is worth saying that it should not be expected that the portfolio behaves like this often, increasing in value while the markets go down. There was some luck involved in this result. The following graphs show patterns that are, presumably, more normal:
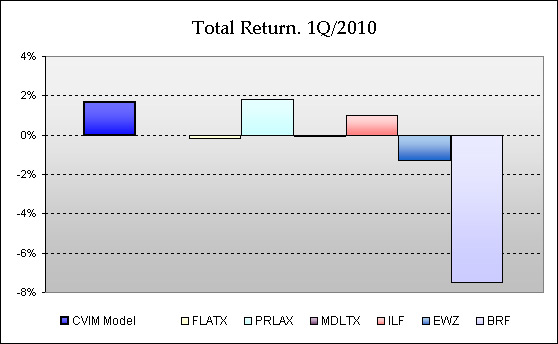
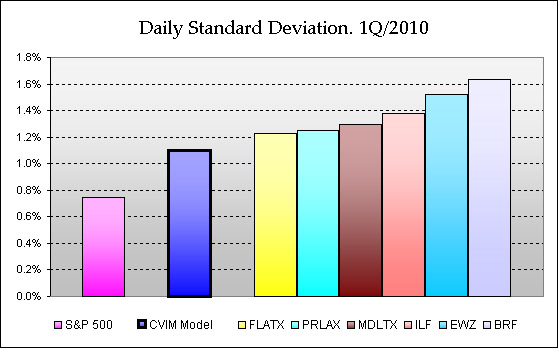
On the first quarter of 2010, as seen here, South America Focus earned almost as much as the best-performing of the funds (PRLAX). Brazilian stock did particularly poorly during this period. Brazil is a market that should have greater influence in the South-America portfolio than in the Latin-America funds, because these include Mexico. Still, the CVIM model outperformed three of the four regional funds. On the other hand, once again, the graph suggests that the overall outperformance of this portfolio was not obtained through an exaggerated risk avoidance.
On the last graph we see the troubles of the last weeks before this writing, mainly the Eurozone problems sparked by Greek-debt concerns, being reflected on the funds' results. South America Focus also retreated, but much less:
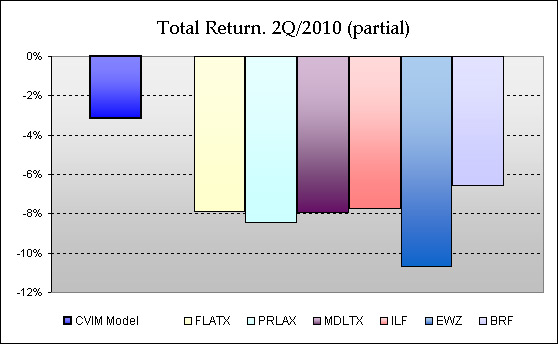
The bottom line is that the portfolio performed comparatively well in all of the three non-overlapping periods. We are comparing with five top funds, but in only one period there was one of them outperforming the CVIM model, and it did it by just a very small margin.
Risk comparison
To further the analysis, let's explore risk. In modern portfolio theory, risk is usually associated to price volatility, meaning something like “the average speed” at which the stock price moves. This measure may be interpreted as the traders' “anxiety” regarding the stock, which is thus related to its perceived risk. It is an imperfect and disputable way of measuring risk, but a useful and widely-accepted one.
Volatility may be expressed as the standard deviation in price changes during a stated period — the less, the better. Covestor publishes monthly risks statistics for every portfolio on their platform, which includes the standard deviation of daily price changes for the month in question. The following graphs compare those results with the data calculated from the funds' historical prices obtained from Yahoo Finance. Once again, we treat the three quarters separatedly:
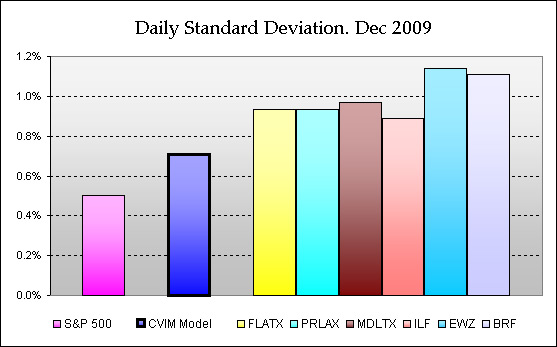
This first graph shows all of the five Latin-American funds being more volatile than the US markets (as represented by the S&P 500 index). This is expected, because emerging markets are more risky (or, at least, more volatile) than developped economies. Their advantageous average total return is justified, at least in part and in theory, by this higher risk that its investors have to assume.
On this graph it can also be seen that the portfolio's volatily falls in between the Latin-American and US markets. This fact suggests that, although it is still a more-volatile investment than holding an index fund that tracks the S&P 500, it is not as risky as typical Latin-American funds. It is a result that is consistent with the qualitative explanation given on our introduction to South America Focus, where we explained how it has, presumably, better diversification than big funds. The fixed-income portion also plays an important role in decreasing risk.
These patterns are repeated in the other two non-overlapping periods:
The (partial) second quarter does not include May at all, because its risk statistics are not yet published at the time of this writing:

Please remember that past performance is no guarantee of future results, and that the period under analysis is not long enough to draw strong conclusions. As mentioned before, the raw data to prepare the seven graphs were obtained from Covestor (for the results of South America Focus) and from Yahoo Finance (for the fund and S&P 500 index data). To integrate the standard deviations reported by Covestor corresponding to the three months making the first quarter of 2010, we took the root mean square, weighing each month in proportion to its number of days. This page is for informational purposes only, CVIM pays me a fee for each client that subscribes to this model, all the disclaimers on the model's profile page apply, and please take appropriate professional advice in any investment decisions.
Conclusions
MORE ABOUT SOUTH AMERICA FOCUS
Portfolio description & how to invest.Performance comparison with Brazil ETF's.
January 2010 report.
February 2010 report.
March 2010 report.
May 2010 report.
More at Covestor Investment Mgmt.
Covestor offers a South American portfolio, composed of stocks and ADRs traded in US exchanges, that provides a vehicle for investing in this fast-developping region with some differences when compared to Latin-American mutual funds and ETF's. These are based, basically, on the possibility to trade more flexibly, given that the assets under management are nowhere near the hundreds of millions managed by the big funds, as it was argumented in our introduction to this model portfolio.
The past history is rather short — just five months and some days more — but the noticeable and sustained outperformance and lower volatility are, to my understanding, signs that the strategy that was explained on the introductory page is working out. To find out more, please visit the rest of our coverage of this portfolio, or its profile page at CVIM. For a performance comparison with other South American funds, you may be interested in visiting the Brazil ETF page that we mentioned before.
Thank you for your interest. I wish you the best in your pursuit of financial success!
SPONSORED LINK
You can auto trade this portfolio with Covestor Investment Management. Click here to find out how.« View the complete list of articles at Simple Stock Investing |
 Subscribe