Don't be fooled into thinking that your success as a stock investor is measured by the increase in price of your portfolio's holdings. What you really want is to make the most money with the least risk. The profits you make are not only price increases, you have to add the money that securities distribute regularly in the form of stock dividends and bond coupons. Moreover, there are fees and taxes to deduct from those gross profits, which depend on your investment decisions. Besides, we also need to factor in the risks involved, because a risky investment that provides modest gains is not as good as a conservative one that earns the same amount.
Total Return
Total return is more adequate than pice increase because distributions usually comprise a significant part of profits.
Gross profit, which is price increase plus distributions, is called total return. For the purpose of investment performance measurement, this metric is more adequate than the rate of change in price alone, because distributions normally comprise a significant part of investment profits in the long run, especially when they are reinvested as soon as they are collected — never underestimate the power of compounding. The average return of the stock market, with dividends reinvested, from 1950 to 2009 was 11 %, while its average price increase for the same period was only 7.2 %. By the way, when we read total return it is usually implicit that they mean with dividends reinvested, but it doesn't strictly have to be so.
Bear in mind that publications that inform returns typically don't include taxes, fees (at least not all fees) or risk. Still, they are useful, as long as we keep in mind that it is convenient to factor in those other elements before making investment decisions. Be careful because some publications completely overlook taxes and fees when, for example, they praise the results of a large-turnover strategy without consideration to its tax efficiency and the costs incurred through brokerage commissions.
Benchmarking
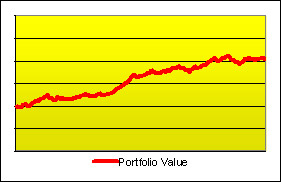 It looks like this investment did great...
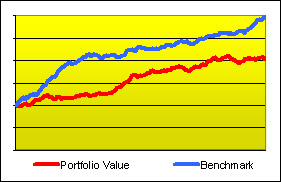 ... but it doesn't look so great if a relevant benchmark did much better during the same period.
The value of investments sometimes rises because of their own merits and sometimes they rise because the whole market is moving up. If we intend to evaluate the skill of an investor, the craftsmanship put into a portfolio or the performance of a particular stock, it is not informative enough to study its total return — we will want to compare it with the whole market's. Actually, to be fair, we will want to compare against the portion of the market that the investor or portfolio is invested in or to which the stock belongs. For example, if a professional was commissioned to design a portfolio of German stocks, we may evaluate her work by comparing her performance (meaning the total return of the portfolio she builds) to an average performance of all the stock markets in the world, but we would obtain a better measure of her success — and thus a better indication of her skill — if we compared against the average performance of German stocks exclusively.
The ‘averages’ employed for these purposes are called indices. A well-known index is the Standard & Poor's 500, or S&P 500, which represents the universe of U.S. large-cap stocks. Other commonly-used indices are the U.S. Dow Jones Industrial Average (DJIA) and Russell 2000, the British FTSE 100, the Japanese Nikkei 225, the German DAX, etc. For example, to evaluate the past performance of a portfolio of U.S. large-cap stocks, we may be interested in comparing its total return with that of the S&P 500 during the same period of time, and we would talk of an out-performance or an under-performance accordingly.
This practice of comparing against a reference is frequently called benchmarking. A benchmark is a point of reference — the word originates from the practice of land surveying but it is nowadays used in many fields.
Risk & Volatility
At the beginning of the article we said that good investment performance means making money with the least risk. Or, better put, it means to have a good relation between the total return that was obtained and the risk (of losing money) that was incurred. But we haven't commented on risk yet, let's start by discussing how a proxy to risk can be established and measured.
Price volatility is like the result of a poll among investors where they're asked about how uncertain they consider the future of the asset to be.
Risk is often measured as how much the return of the investment varies around an average (or expected) value. In finance, this ‘amount of variation’ is called volatility. Why is the volatility of a past record of price changes used as a proxy of investment risk? The reason lies in the fact that asset-price movement is usually a response to everyday news that affect the outlook of the asset. When news are (in average) considered to be good, market participants trade at higher prices, and the opposite occurs when news are considered to be bad. If the price movements of a stock have been pronounced in its recent history, it means that traders have been (in average) judging that the future value of the stock was very much dependent on news, which hints that the price may plunge if future news happen to be bad. On the other hand, if prices have low variability, it indicates that the stock is considered resistant to events. Therefore, price volatility is like the result of a poll among investors where they're asked about how uncertain they consider the future of the asset to be — or, put in other words, how risky they think it is.
To give an example, let's compare a savings account with a stock investment. Money saved in a saving account will grow at around 3.5 % per year. Some years it might grow a little less, a bit more during others, but the invested value will always be close to the expected value based on the approximate rate of 3.5 % unless something unlikely happens like the bankruptcy of the bank. Variation around the average value, or volatility, is pretty low. On the other hand, stock investments can vary quite much. As we said before, the historical profitability of the U.S. large-cap market is of approximately 11 % per year, but it is not unlikely to see a 30 % rise or a 10 % drop in one year. Stock investments are therefore much more volatile. This obviously implies more risk, because stocks may lose a significant portion of their value anytime, which wouldn't happen with an investment with little volatility such as a certificate of deposit or savings account.
Typical metrics of volatility —and consequently of investment risk— are variance and standard deviation. These terms come from statistical science and reflect essentially the same thing but expressed in different ways — the standard deviation of a set of numbers is equal to the positive square root of the variance of the same set. For investment-risk calculation, the set of numbers that is used is a set of historical price changes — either daily price changes, monthly, yearly, etcetera, depending on the type of investment volatility being calculated (e.g., ‘monthly variance’ or ‘daily standard deviation’). To understand how a variance or a standard deviation can describe the spreadness of a set of numbers you can visit this short and sweet tutorial where the numbers in question are the heights of some cute dogs (in that article they use the word mean to refer to what we called expected value).
Beta
In financial theory, riskier investments are expected to be more profitable because investments normally offer a reward in exchange of risk absorption — if they offered no reward, investors would buy the less-risky assets instead. The savings account in the example above offered a non-impressive return but it was reasonable given its predictable performance. Historically, stock investments offered larger returns, as it would be expected from their higher uncertainty. We say that stock investments offered a risk-premium over savings accounts.
From what we said so far, we may infer that the expected return of an investment depends on its volatility as measured through the standard deviation (or variance) of historical prices, but that conclusion would be wrong because there's more to the argument.
Not all kinds of risk offer risk premium. Risky assets that are good diversifiers offer low or no premium.
Imagine an hypothetical, very volatile investment that has a positive expected return and experiences daily price changes that don't go in the same direction as the fluctuations of the market as a whole. One day the market (as represented by an index) rises 0.5 % while the investment drops 2 %, another day the index loses 1 % but the investment gains 5 %. On some days both either rise or drop, but more frequently they move in opposite directions. We would say that their price changes are negatively correlated. What may we infer from such a behavior? As we said before, price movements are market responses to everyday news. If an investment generally moves in direction opposite to the market, it means that news that affect the market negatively have a positive impact on the investment. The market participants would thus be expressing that they think that, if the whole market does bad in the future, the investment will do well.
If such an investment had a positive expected return, it would make a great diversifier for any broad-market portfolio. Investors will want to purchase it, regardless of its volatility, to incorporate certainty into their portfolios because, if the market does badly, that component will probably do well and compensate for some of their losses. Therefore, the investment wouldn't need to offer a reward to be chosen.
Such extreme examples are infrequent —actually they are practically inexistent, because assets that are negatively correlated to the market normally have negative expected return— but the same concept applies to normal investments: if the price changes of an asset are less correlated to the market's, the asset is a better diversifier and thus offers less risk premium. Not all kinds of risk offer risk premium.
Investment volatility reflects the sum of two forms of risk: idiosyncratic risk, which is the one that can be eliminated through diversification, and systematic risk, which is the one that cannot. The investment in the example above has a lot of risk, as shown by its high volatility, but it is all idiosyncratic risk. Only systematic risk offers a reward.
A common mistake is to think that low-beta investments are low risk, but beta says nothing about idiosyncratic risk.
A frequently-used measure of systematic risk is beta. It is a relative measure: beta is the relation between an investment's systematic risk and the market risk. If a stock or a portfolio has a beta equal to 1, it means that it has as much systematic risk as there is risk in the market. Volatile stocks can present high betas, for example equal to 3 or 4. As explained before, those kinds of stocks are expected to return a premium in exchange for the unavoidable risk they contain.
A common mistake is to think that low-beta investments are low risk, but beta says nothing about idiosyncratic risk. Low-beta investments can be very volatile, and therefore risky, because they can contain much idiosyncratic risk. If you are incorporating such an investment into a well-diversified portfolio, then beta is a reasonable measure of the risk you're adding because idiosyncratic risk will be pretty much ‘washed away’ by diversification. But be careful if you use betas with undiversified portfolios.
Jensen's Alpha
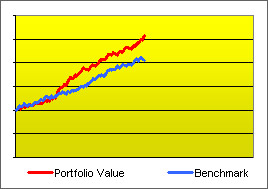 The portfolio managers seem to be doing a great job!
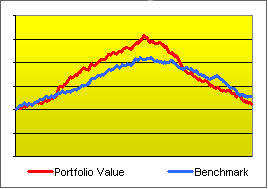 But, when a longer period is seen, signs of higher risk taking surface. Were they doing a great job or simply taking more risk?
In the section about benchmarking we talked about the convenience of comparing performance with a benchmark but we didn't factor in risk. We gave the example of an asset manager investing in German stocks, showing that it would be informative to compare her performance with that of a relevant index such as the DAX because a greater total return may hint that the portfolio was constructed with superior skill. But greater total return may also be simply the consequence of higher risk taking. Therefore, a higher return doesn't say much about the manager's ability unless we bring risk into the picture. Thus, it is useful to employ metrics that discount performance that is (or seems to be) attributable to higher-risk taking. These are called risk-adjusted measures, Morningstar's star system for comparing mutual funds is an example. Another popular example, non proprietary in this case, is Jensen's alpha.
Jensen's alpha is the return obtained on top of the market return discounting any effect that can be attributed to risk taking. If a portfolio has as much systematic risk as the market (or at least it seems to be as suggested by historical volatility) and it returned 1 % more than the market annually, then its alpha is said to be +1. In this calculation, the market is represented by an index such as the S P 500, so it is relevant to state which index is being used in the calculation of alpha. Likewise, if the portfolio returned 1 % less than the index, alpha is equal to -1. Now, if a portfolio has more risk than the market, then it should have gotten more than a 1 % extra return to obtain an alpha of 1. If the risk difference is large enough, a 1 % extra return may even result in a negative alpha.
Adherents to the efficient-markets theory would say that positive alpha is entirely attributable to luck, and therefore unsustainable.
Therefore, we may say that the asset manager in the German-stock-portfolio example did a good job if she obtained a positive (Jensen's) alpha measured relative to the DAX. Nevertheless, that out-performance could also be, in part or in full, the result of plain good luck — adherents to the efficient-market theory would say that it is fully explained by luck.
Summary
Let's summarize some important points that were covered:
- Price increases can be misleading if taken as measures of investment performance, total return is a more-adequate metric.
- Remember to include the taxes and fees that apply to your case before making investment decisions.
- To evaluate managers, portfolios and stocks, it is informative to compare their returns to that of relevant indices.
- Price volatility is a reasonable proxy for investment risk. It can be expressed as standard deviation or variance.
- Undiversifiable risk, also called systematic risk, normally offers a reward in terms of return.
- Beta indicates systematic risk. High beta stocks have high risk.
- Low beta stocks may or may not have low risk, because beta says nothing about diversifiable risk (also called idiosyncratic risk).
- Therefore, beta is a reasonable measure of risk if you are dealing with diversified portfolios, but be careful if you're using them with undiversified ones.
- Higher returns can be the consequence of taking higher systematic risk, so you will be interested in analyzing a risk-adjusted measure, meaning one that factors out any potential risk premium.
- Jensen's alpha is a popular risk-adjusted measure of performance relative to an index. Positive alpha can be attributed to skill but also to luck.
« Invest in Stock and Bonds? Why? | Stock Investing Guide | Passive Investing Strategy » |
 Subscribe